NATIONAL COUNCIL OF APPLIED
ECONOMIC RESEARCH
Home
TSA
National TSA
Table 1: Inbound Tourism Expenditure
Table 2: Domestic Tourism Expenditure
Table 3: Outbound Pre - trip Tourism Expenditure
Table 4: Total Inbound Tourism Consumption
Table 5: Production Account of Tourism Industries
Table 6: Domestic Supply and Internal Tourism Consumption
Table 7: Tourism Employment
Table 8: Tourism Gross Fixed Capital Formation
Table 9: Tourism Collective Consumption Expenditure
Table 10: Tourism Non-Monetary Indicators
Regional TSA
Tourism's Contribution to Economy
Table 1A : Inbound Tourism Expenditure incurred by International Tourists
Table 1B : Inbound Tourism Expenditure incurred by Tourists from other states
Table 2 : Domestic Tourism Expenditure Incurred by Tourists from within the State
Table 3 : Outbound Pre-trip Tourism Expenditure
Table 4 : Total Inbound Tourism Consumption
Table 5 : Production Account of Tourism Industries
Table 6 : Domestic Supply and Internal Tourism Consumption
Table 7 : Tourism Employment
Data Source
DTS
Demographic Characteristics
Trips Characteristics
Tourists
Social Profile
Travel Pattern
Tourist Across Purpose
By Gender, State of Origin, State of Destination, Average Nights Spent
By Religion
By Social Groups
By Modes of Travel
By Types of Stay
By Months of Travel
By Age Group
By Main Destination
IPS
Demographic Details
Trip Characteristics
Purpose of Travel
Overall Experience & Perception
Reports
Glossary
Home
TSA
National TSA
Regional TSA
Data Source
Reports
Glossary
3
rd
Tourism Satellite Account of India
Reference Year : 2015-16
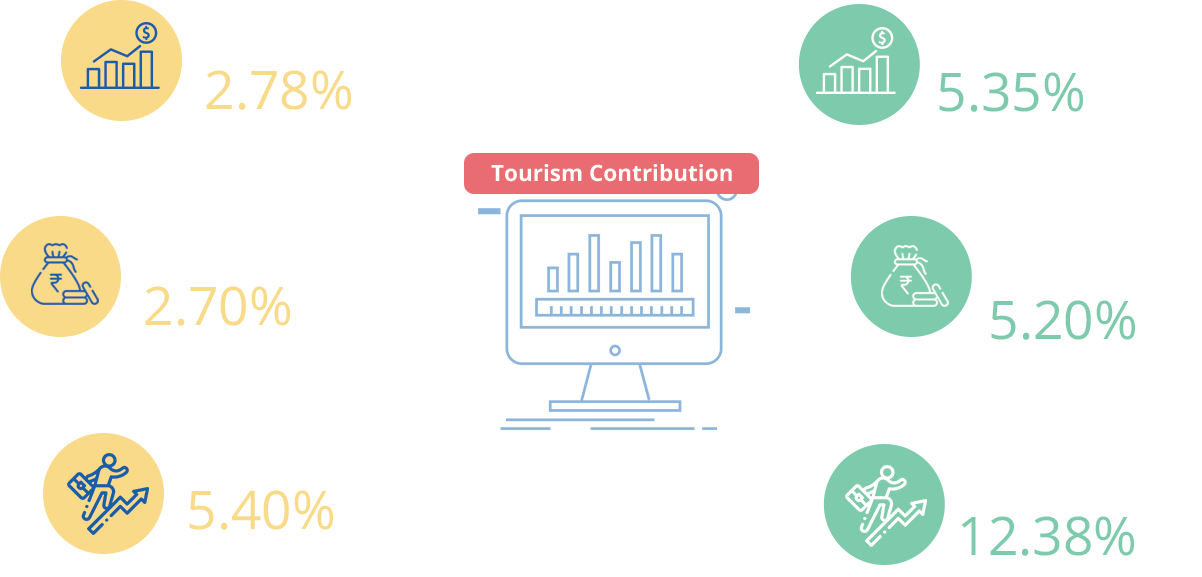
Value of Tourism Direct GVA
INR
3.46
Trillion
Value of Tourism Direct GDP
INR
3.64
Trillion
Tourism Direct Jobs
31.5
Million
Total Inbound Tourists
13.52
Million
Total Outbound Tourists
20.29
Million
Total Domestic Trips
1201.96
Million
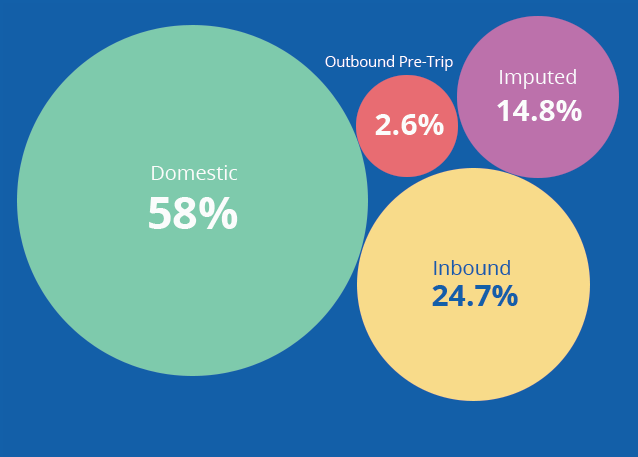
Value of total tourism consumption INR 9.5 trillion
Distribution by types
Share of Tourism in State’s GVA
Direct (%)
Indirect (%)
Total (%)
Goa
5.50
6.05
11.55
Andaman & Nicobar Islands
4.63
5.76
10.39
Chandigarh
3.87
5.30
9.17
Lakshadweep
4.30
4.73
9.02
Kerala
4.34
4.38
8.72
Delhi
4.32
3.47
7.78
Jammu & Kashmir
3.68
3.81
7.48
Himachal Pradesh
3.20
3.69
6.89
Bihar
2.96
3.03
5.99
Karnataka
2.63
3.11
5.74
Rajasthan
2.73
2.90
5.63
Maharashtra
3.08
2.44
5.52
Manipur
2.38
3.12
5.50
Tamil Nadu
2.59
2.78
5.37
All India
2.78
2.57
5.35
Uttarakhand
2.29
2.98
5.27
Meghalaya
2.39
2.83
5.22
Telangana
2.29
2.78
5.07
Odisha
2.43
2.57
5.00
Madhya Pradesh
2.39
2.51
4.90
Andhra Pradesh
2.29
2.38
4.66
Uttar Pradesh
2.24
2.40
4.63
Chhattisgarh
2.13
2.31
4.44
Sikkim
2.12
2.28
4.40
Assam
2.19
2.12
4.32
West Bengal
2.09
2.21
4.30
Jharkhand
2.10
2.07
4.18
Puducherry
1.73
2.35
4.08
Gujarat
1.78
2.17
3.96
Haryana
1.95
1.93
3.88
Punjab
1.90
1.84
3.75
Nagaland
1.87
1.68
3.55
Tripura
1.53
1.46
2.99
Mizoram
1.25
1.30
2.55
Arunachal Pradesh
1.21
1.18
2.39
Dadra & Nagar Haveli
0.79
1.00
1.79
Daman & Diu
0.75
0.61
1.36
Share of Tourism in State’s Employment
Direct (%)
Indirect (%)
Total (%)
Puducherry
14.25
41.99
56.24
Lakshadweep
21.95
27.76
49.71
Goa
19.38
21.53
40.92
Daman & Diu
11.71
17.65
28.35
Kerala
11.20
14.67
25.87
Andaman & Nicobar Islands
11.09
12.99
24.07
Dadra & Nagar Haveli
7.01
16.79
23.81
Uttarakhand
7.99
13.19
21.18
Delhi
12.40
8.64
21.05
Himachal Pradesh
10.23
10.00
20.23
Telangana
5.13
12.70
17.83
Karnataka
5.46
12.27
17.74
Jammu & Kashmir
6.74
9.72
16.45
Tamil Nadu
6.36
9.61
15.97
Gujarat
5.85
9.55
15.39
West Bengal
6.41
7.93
14.34
Sikkim
6.84
6.23
13.07
Andhra Pradesh
5.41
7.43
12.84
Maharashtra
5.66
6.80
12.46
All India
5.40
6.98
12.38
Chandigarh
6.70
5.66
12.37
Punjab
6.69
5.65
12.33
Odisha
5.27
6.84
12.11
Manipur
6.25
5.80
12.05
Uttar Pradesh
4.46
6.93
11.39
Rajasthan
5.18
6.08
11.26
Mizoram
4.57
6.38
10.96
Bihar
4.17
6.33
10.50
Meghalaya
2.87
7.57
10.44
Haryana
5.98
4.17
10.15
Jharkhand
3.89
5.23
9.12
Assam
4.41
4.34
8.75
Madhya Pradesh
3.34
5.11
8.45
Nagaland
3.58
4.76
8.34
Chhattisgarh
2.41
5.24
7.65
Tripura
3.05
2.01
5.05
Arunachal Pradesh
2.20
2.56
4.76