3rd Tourism Satellite Account of India
Reference Year : 2015-16

Value of Tourism Direct GVA

INR 3.46 Trillion

Value of Tourism Direct GDP

INR 3.64 Trillion

Tourism Direct Jobs

31.5 Million

Total Inbound Tourists

13.52 Million

Total Outbound Tourists

20.29 Million

Total Domestic Trips

1201.96 Million

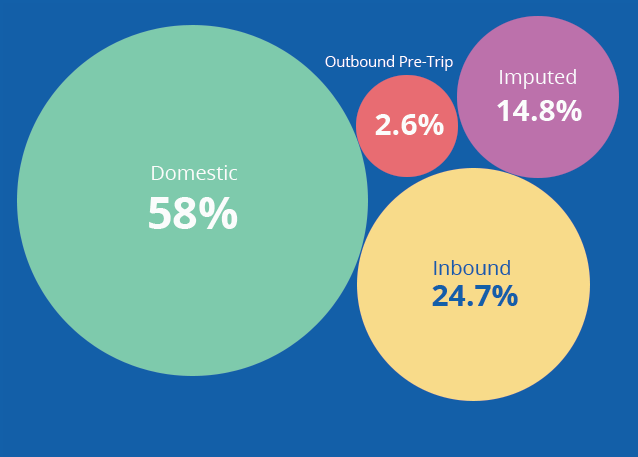
Value of total tourism consumption INR 9.5 trillion
Distribution by types

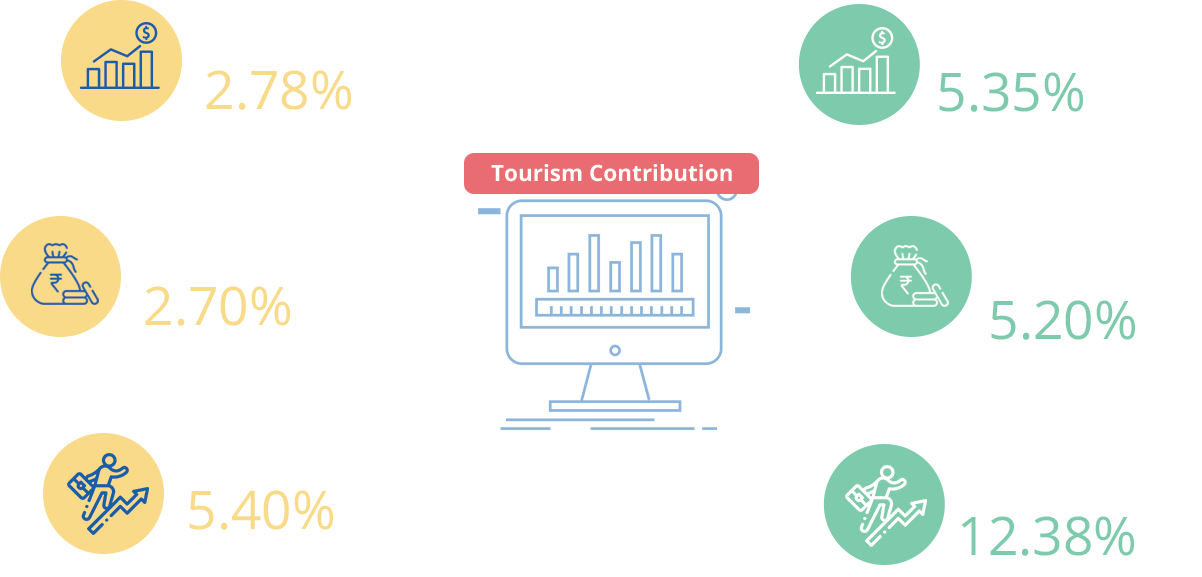
Share of Tourism in State’s GVA

  • Direct (%)
  • Indirect (%)
  • Total (%)
  • Goa
    5.50
    6.05
    11.55
  • Andaman & Nicobar Islands
    4.63
    5.76
    10.39
  • Chandigarh
    3.87
    5.30
    9.17
  • Lakshadweep
    4.30
    4.73
    9.02
  • Kerala
    4.34
    4.38
    8.72
  • Delhi
    4.32
    3.47
    7.78
  • Jammu & Kashmir
    3.68
    3.81
    7.48
  • Himachal Pradesh
    3.20
    3.69
    6.89
  • Bihar
    2.96
    3.03
    5.99
  • Karnataka
    2.63
    3.11
    5.74
  • Rajasthan
    2.73
    2.90
    5.63
  • Maharashtra
    3.08
    2.44
    5.52
  • Manipur
    2.38
    3.12
    5.50
  • Tamil Nadu
    2.59
    2.78
    5.37
  • All India
    2.78
    2.57
    5.35
  • Uttarakhand
    2.29
    2.98
    5.27
  • Meghalaya
    2.39
    2.83
    5.22
  • Telangana
    2.29
    2.78
    5.07
  • Odisha
    2.43
    2.57
    5.00
  • Madhya Pradesh
    2.39
    2.51
    4.90
  • Andhra Pradesh
    2.29
    2.38
    4.66
  • Uttar Pradesh
    2.24
    2.40
    4.63
  • Chhattisgarh
    2.13
    2.31
    4.44
  • Sikkim
    2.12
    2.28
    4.40
  • Assam
    2.19
    2.12
    4.32
  • West Bengal
    2.09
    2.21
    4.30
  • Jharkhand
    2.10
    2.07
    4.18
  • Puducherry
    1.73
    2.35
    4.08
  • Gujarat
    1.78
    2.17
    3.96
  • Haryana
    1.95
    1.93
    3.88
  • Punjab
    1.90
    1.84
    3.75
  • Nagaland
    1.87
    1.68
    3.55
  • Tripura
    1.53
    1.46
    2.99
  • Mizoram
    1.25
    1.30
    2.55
  • Arunachal Pradesh
    1.21
    1.18
    2.39
  • Dadra & Nagar Haveli
    0.79
    1.00
    1.79
  • Daman & Diu
    0.75
    0.61
    1.36

Share of Tourism in State’s Employment

  • Direct (%)
  • Indirect (%)
  • Total (%)
  • Puducherry
    14.25
    41.99
    56.24
  • Lakshadweep
    21.95
    27.76
    49.71
  • Goa
    19.38
    21.53
    40.92
  • Daman & Diu
    11.71
    17.65
    28.35
  • Kerala
    11.20
    14.67
    25.87
  • Andaman & Nicobar Islands
    11.09
    12.99
    24.07
  • Dadra & Nagar Haveli
    7.01
    16.79
    23.81
  • Uttarakhand
    7.99
    13.19
    21.18
  • Delhi
    12.40
    8.64
    21.05
  • Himachal Pradesh
    10.23
    10.00
    20.23
  • Telangana
    5.13
    12.70
    17.83
  • Karnataka
    5.46
    12.27
    17.74
  • Jammu & Kashmir
    6.74
    9.72
    16.45
  • Tamil Nadu
    6.36
    9.61
    15.97
  • Gujarat
    5.85
    9.55
    15.39
  • West Bengal
    6.41
    7.93
    14.34
  • Sikkim
    6.84
    6.23
    13.07
  • Andhra Pradesh
    5.41
    7.43
    12.84
  • Maharashtra
    5.66
    6.80
    12.46
  • All India
    5.40
    6.98
    12.38
  • Chandigarh
    6.70
    5.66
    12.37
  • Punjab
    6.69
    5.65
    12.33
  • Odisha
    5.27
    6.84
    12.11
  • Manipur
    6.25
    5.80
    12.05
  • Uttar Pradesh
    4.46
    6.93
    11.39
  • Rajasthan
    5.18
    6.08
    11.26
  • Mizoram
    4.57
    6.38
    10.96
  • Bihar
    4.17
    6.33
    10.50
  • Meghalaya
    2.87
    7.57
    10.44
  • Haryana
    5.98
    4.17
    10.15
  • Jharkhand
    3.89
    5.23
    9.12
  • Assam
    4.41
    4.34
    8.75
  • Madhya Pradesh
    3.34
    5.11
    8.45
  • Nagaland
    3.58
    4.76
    8.34
  • Chhattisgarh
    2.41
    5.24
    7.65
  • Tripura
    3.05
    2.01
    5.05
  • Arunachal Pradesh
    2.20
    2.56
    4.76